...
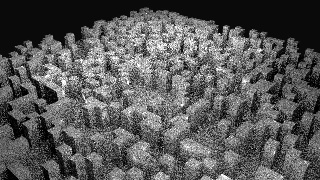
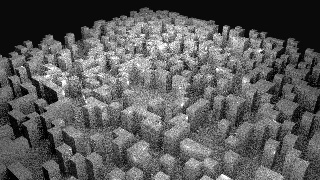
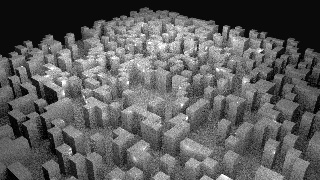
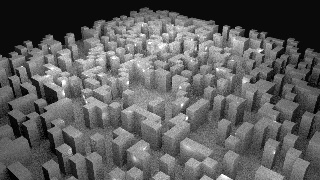
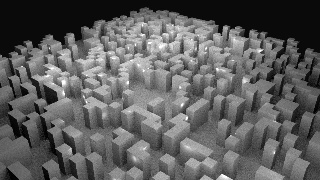
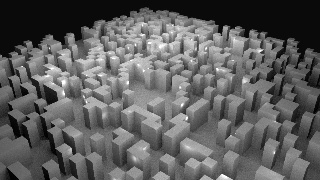
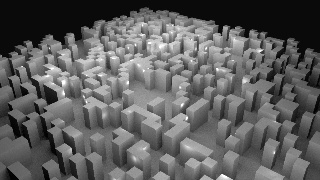
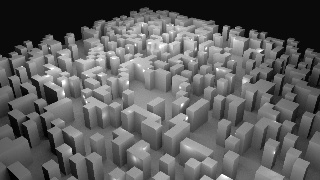
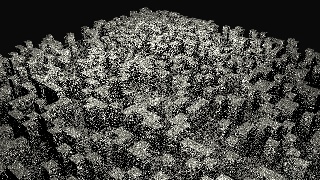
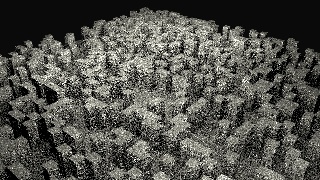
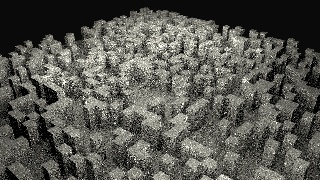
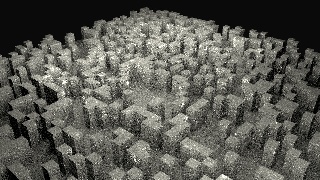
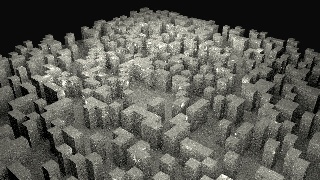
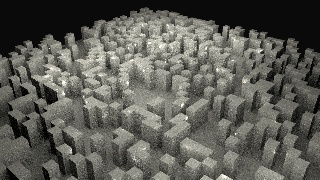
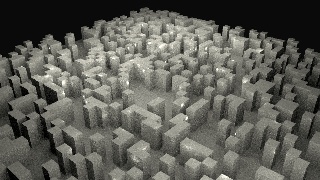
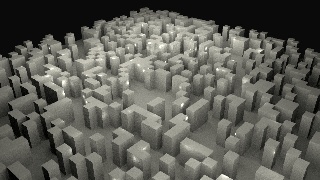
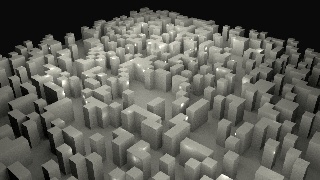
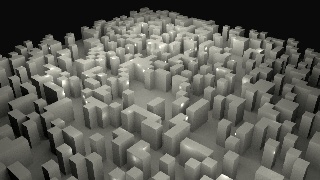
We will start by creating a "ground truth" image for each renderer. This image is generated by using a very large amount of samples so there is no more apparent noise. We will then render several images with varying amount of samples and measure the RMSE between these images and ground truth. Timings will be taken at each render. Having this data will allow us to draw a conclusion about convergence rate and general performance.
The Setup
| Renderer | Arnold | RenderMan/RIS | 3Delight |
|---|---|---|---|
| Sampling | |||
| Geo Light | |||
| Notes | |||
Notes About Sampling Parameters
...
| Samples | 2 | 4 | 8 | 16 | 32 | 64 | 128 | 256 |
|---|---|---|---|---|---|---|---|---|
| Image | ||||||||
| Time | 5.72s | 8s | 12.82 s | 22.18 s | 40.92 s | 86.91 | 165.69 s | 302.98 |
| TTFP | 3 | 3 | 3 | 3 | 3 | 3 | 3 | |
| Shadow Rays | 2.45 M | 3.13 M | 4.51 M | 7.27 M | 12.78 M | 23.8 M | 45.88 M | 90.1 M |
| RMSE | 0.0933142 | 0.0658266 | 0.0441248 | 0.0290439 | 0.0185575 | 0.0117566 | 0.00752546 | 0.00449892 |
RenderMan/RIS
| Samples | 1 | 2 | 4 | 8 | 16 | 32 | 64 | 256 | 512 | 1024 |
|---|---|---|---|---|---|---|---|---|---|---|
| Image | ||||||||||
| Time | 6.74s | 7.23s | 7.99s | 9.42s | 12.12s | 18.51s | 29.40 | 1:38.08 | 3:15.77 | 6:23.39 |
| TTFP | 3.1s | 3.2 | 4s | 4.7s | 6.7s | 9s | 15.5s | 51.2s | 97s | |
| Rays | 1.47 M | 2.94 M | 5.88 M | 11.7 M | 21.1M | 47.02 M | 94.14 M | 376.3 M | 751.3 M | 1499 M |
| RMSE | 0.151125 | 0.121487 | 0.0953649 | 0.0728148 | 0.0520606 | 0.0373876 | 0.0265388 | 0.0138148 | 0.00854045 | 0.00396 |
The following plot gives us a good idea on the algorithm sophistication of the different light samplers.
|
...
