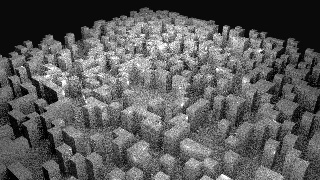
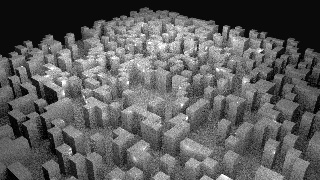
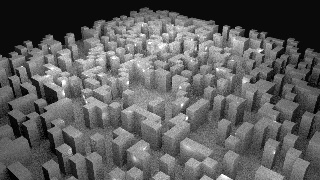
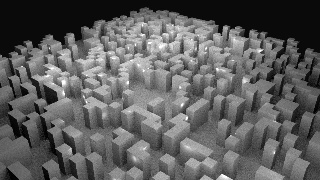
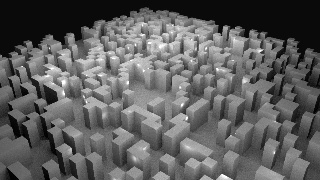
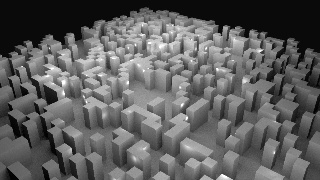
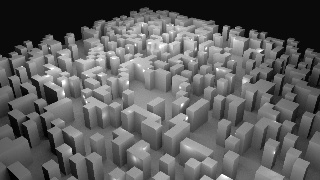
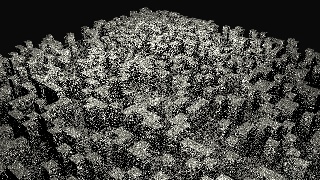
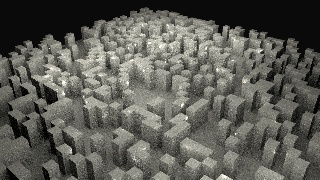
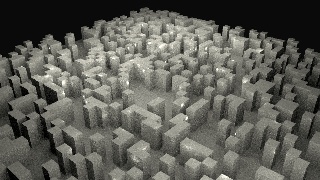
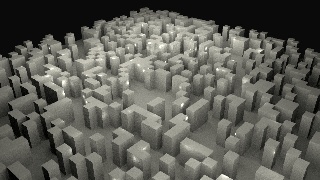
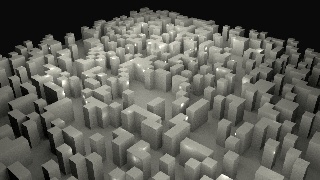
...
| The following graph gives a good idea on the algorithm sophistication of the different light samplers. |
| |||||||||||||||||||||||||||||||||||||||||||||||||||||||||||||||||||||||
| The following graph shows the time required to achieve a certain quality. From user's perspective, this is an important quantity. |
| |||||||||||||||||||||||||||||||||||||||||||||||||||||||||||||||||||||||
| The following graph shows how much time it takes to build the acceleration data structure depending on sample/ray count. |
|
Arnold
*TTFP = Time to first pixel.
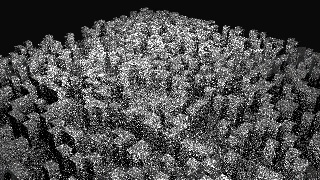
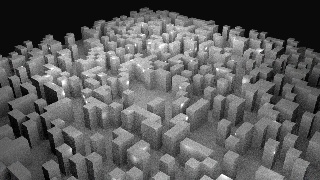
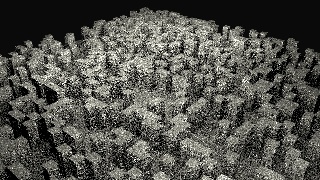
| Samples (effective) | 2 (1.23) | 4 (4.91) | 8 (19.64) | 10 (30) | 16 (78.56) | 32 (314.29) | 64 (1257.18) | |
|---|---|---|---|---|---|---|---|---|
| Image | ||||||||
| Time | 1s1 | 2s2 | 6s6 | 9s9 | 21s21 | 1:21 | 81 | 4928:12 |
| TTFP* | 0s0 | 0.35s35 | 1.2s2 | 2.0 | 3.2s2 | 11s11 | 41s41 | |
| Shadow Rays | 0.678 M | 3.26 M | 10.8 M | 16.94 M | 43.4 M | 173.6 M | 694.5 M | |
| RMSE | 0.15699 | 0.100115 | 0.0501787 | 0.0396399 | 0.0242515 | 0.0117413 | 0.00693426 |
...
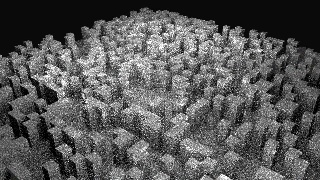
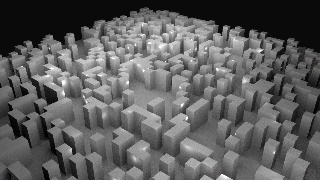
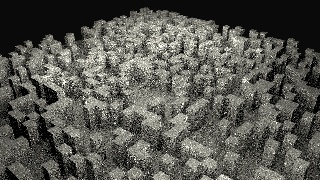
| Samples | 2 | 4 | 8 | 16 | 32 | 64 | 128 | 256 | |||||||
|---|---|---|---|---|---|---|---|---|---|---|---|---|---|---|---|
| Image | |||||||||||||||
| Time (s) | 5.72s72 | 7.63s63 | 12.82 s | 20.68 s | 37.75s75 | 72.07s07 | 142.05 s | 302.98 | |||||||
| TTFP | 3 | 3 | 3 | 3 | 3 | 3 | (s) | 2 | 2 | 2 | 2 | 2 | 2 | 2 | 23 |
| Shadow Rays | 2.45 M | 3.13 M | 4.51 M | 7.27 M | 12.78 M | 23.8 M | 45.88 M | 90.1 M | |||||||
| RMSE | 0.0933142 | 0.0658266 | 0.0441248 | 0.0290439 | 0.0185575 | 0.0117566 | 0.00752546 | 0.00449892 |
...
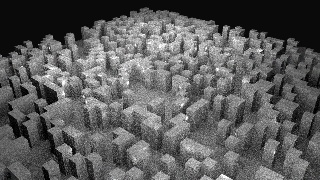
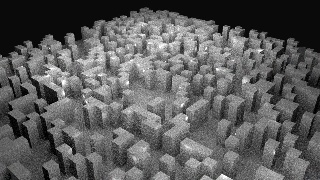
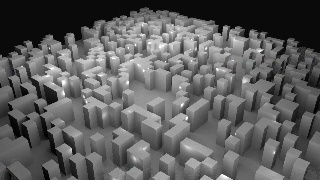
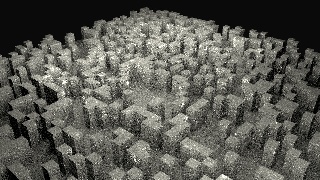
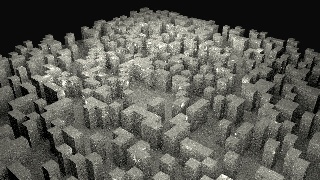
| Samples | 1 | 2 | 4 | 8 | 16 | 32 | 64 | 256 | 512 | 1024 |
|---|---|---|---|---|---|---|---|---|---|---|
| Image | ||||||||||
| Time (s) | 6.74s74 | 7.23s23 | 7.99s99 | 9.42s42 | 12.12s12 | 18.51s51 | 29.40 | 1:3898.08 | 3:15195.77 | 6:23.39 |
| TTFP (s) | 3.1s1 | 3.2 | 4s4 | 4.7s7 | 6.7s7 | 9s9 | 15.5s5 | 51.2s2 | 97s97 | |
| Rays | 1.47 M | 2.94 M | 5.88 M | 11.7 M | 21.1M | 47.02 M | 94.14 M | 376.3 M | 751.3 M | 1499 M |
| RMSE | 0.151125 | 0.121487 | 0.0953649 | 0.0728148 | 0.0520606 | 0.0373876 | 0.0265388 | 0.0138148 | 0.00854045 | 0.00396 |
...
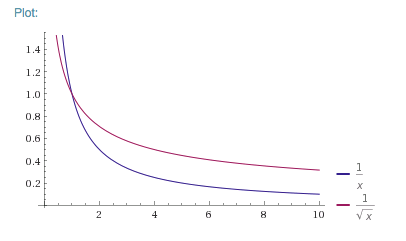
- 3Delight Variance ~ 1/x
- Arnold Variance ~ 1/sqrt(x)
- RenderMan/RIS Variance ~ 1/sqrt(x) (but could be slightly worse, needs more tests)
- 3Delight is slower to generate these samples. For draft renders (high variance), Arnold is fastest. For final renders (low variance) 3Delight becomes increasingly faster with increasing samples.
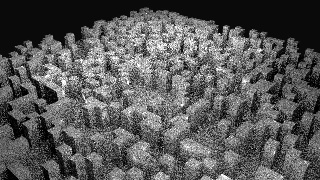
- Both Arnold and RenderMan/RIS produce biased images at low sample counts. More specifically: images are darker. 3Delight manages to keep the same energy overall independent on independently of sample counts.
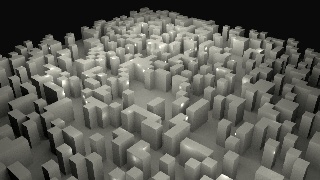
- Arnold, 3Delight and RenderMan/RIS rely on acceleration data structures to sample the geometric area lights. In Arnold and RenderMan, the algorithmic complexity to build those data structures is tied – linearly, as the graph shows – to the number of samples (as well as the complexity of the light). In 3Delight, only to the complexity of the light matters (time to first pixel for 3Delight was 2-3 seconds no matter how many samples there are).
Resources
| RenderMan/RIS | Arnold | 3Delight | |
|---|---|---|---|
| Images and Stats | |||
| Maya Scene | |||
| Remarks | The same scene works with both Maya and Arnold | ||
