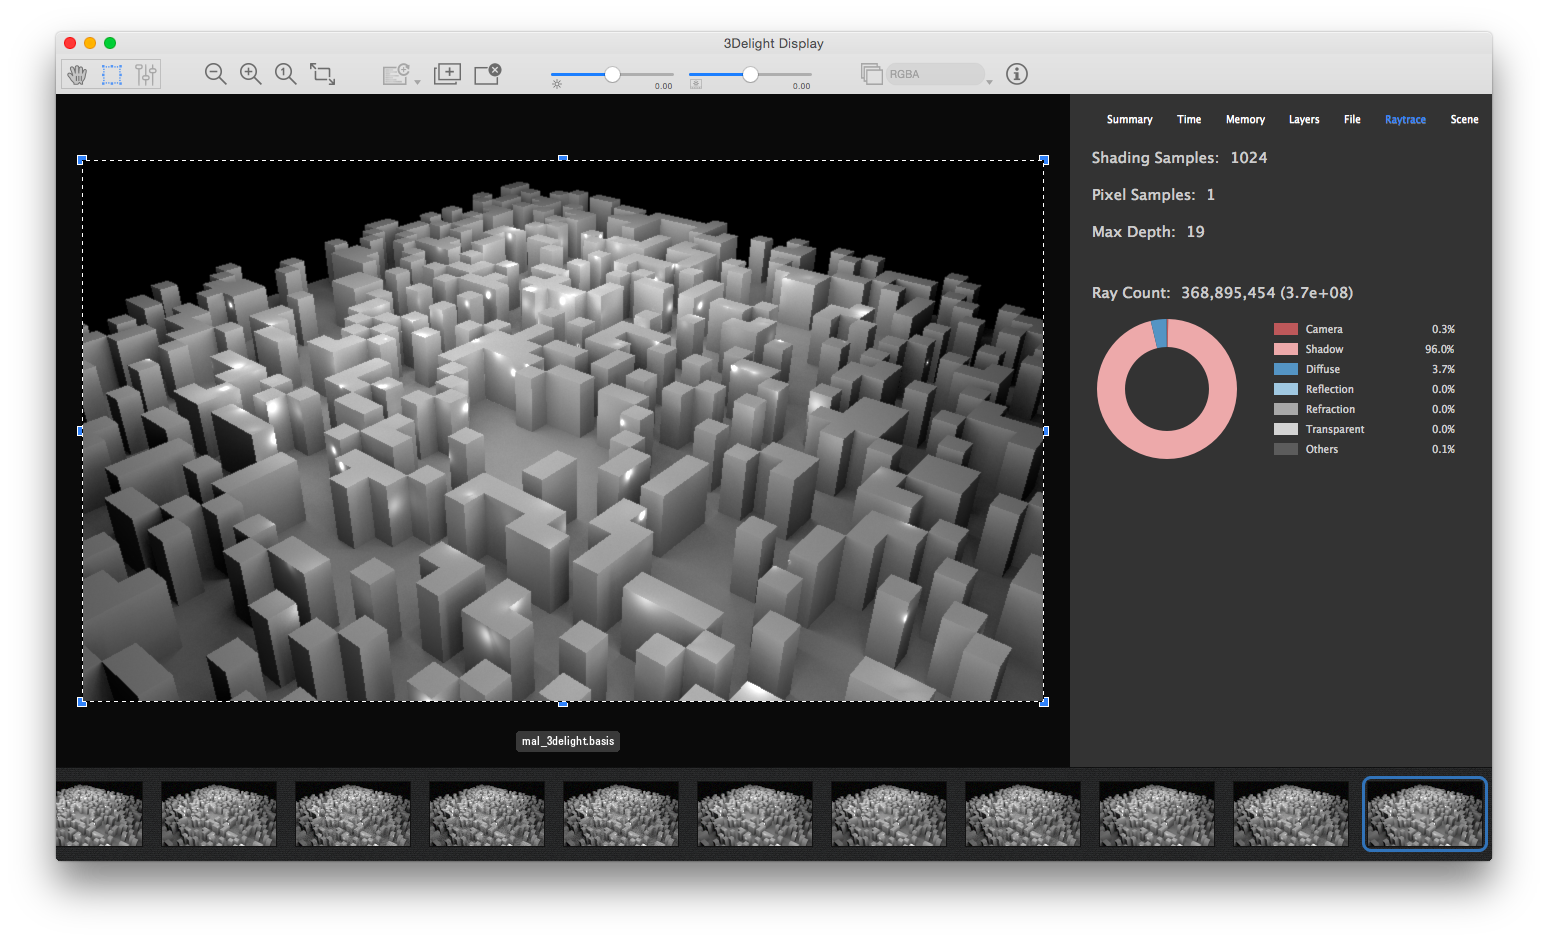
It is not uncommon for production scenes to rely heavily on geo area lights. In this test we will compare Geo Light geo light sampling technology in 3Delight OSL, Arnold and RenderMan/RIS. We will use a test with a geometric area light that is composed of a relatively large number of faces. The test, although limited, should allow us to find the convergence rate of each algorithm as well as general performance.
The Scene
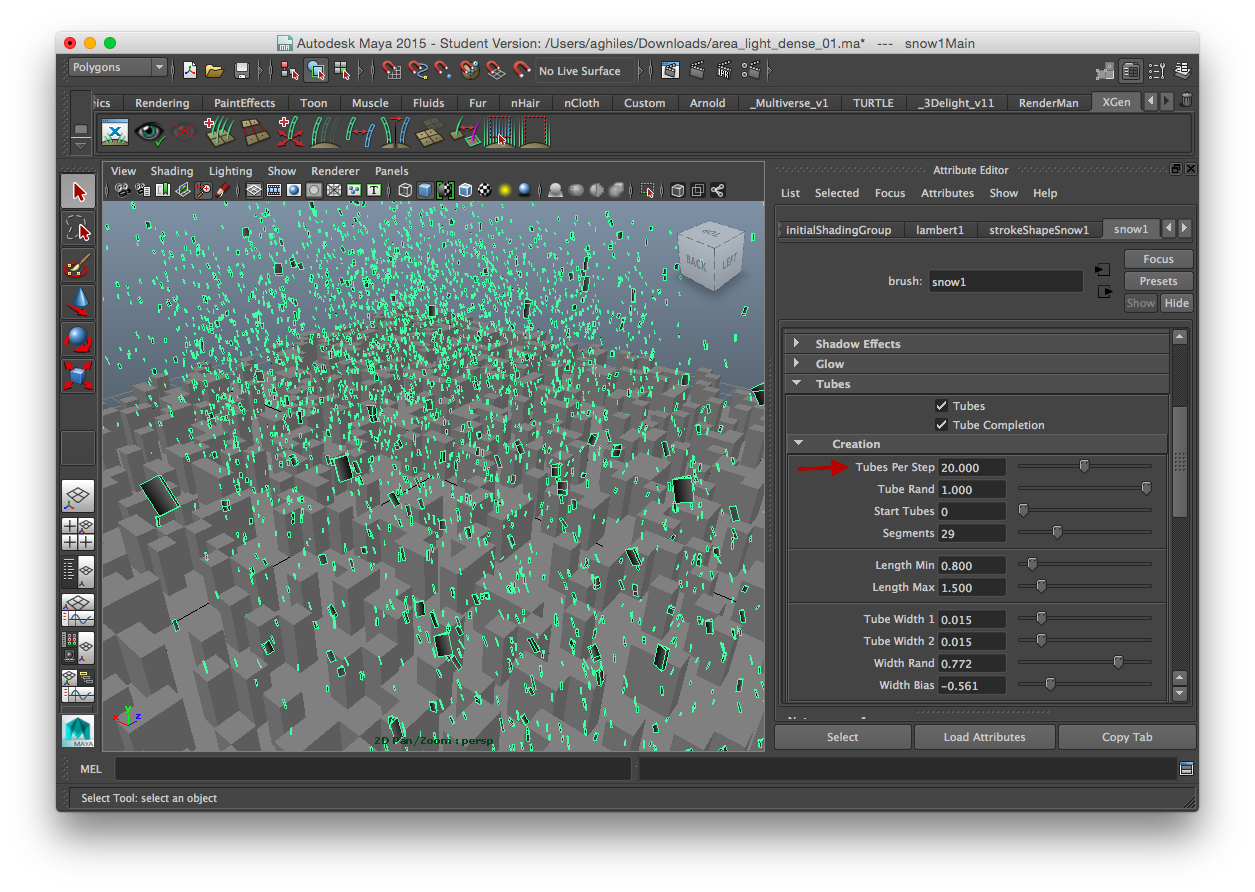 The test scene allows for procedural generation of floating area lights using the "Tubes Per Step" PaintEffects attribute.
...
The scene is designed to procedurally generate a number of area lights floating on top of a "city".
- Only diffuse reflectors. The original test scene had a diffuse+specular surface but that generated a considerable amount of additional noise in Arnold.Since we want to concentrate on light sampling here, we decided to go for a simpler setup.
- We will disable any adaptive sampling so to make sure we have very close raymeaningful ray-counts.
- We will use only direct lighting to estimate the geometric area light contribution. In the statistics files for each renderer, one can see that we have only one path lenghtlength.
- The light sources contain about 80K triangles.
- All Renders are done in Maya 2016.
The Renderers
| Info |
|---|
RenderMan/RIS 21 is about to be released with new sampling technology. We will complete the test as soon as the renderer is available. |
| Arnold | RenderMan/RIS | 3Delight OSL |
|---|
| Version |  Image Added Image Added
|  Image Added Image Added
|  Image Added Image Added
|
|---|
| Technology | Unidirectional path tracer. | Using unidirectional path tracer. Other options are available but not useful for this test. | Unidirectional path tracer. |
|---|
| Shaders | C++ | C++ | OSL |
|---|
Methodology
We are interested to find out about:
- The quality of the geo light samples drawn by each renderer. How fast do we converge to ground truth by increasing the number of samples ?
- Performance. How fast is the sampler to produce an image of a given quality ?How do the algorithms scale with more complex area light geometry ?
We will start by creating a "ground truth" image for each renderer (this image is ; an image generated by using a very large amount of samples so there is no more apparent noise). We . Although it is normal for images generated by each renderer to vary slightly, encouragingly, images produced by both 3Delight and Arnold are almost exactly the same. We will then render several images with varying amount of samples and measure the RMSE between these images and the ground truth for each renderer. Timings and statistics will be taken collected at each rendererrender. Having this data will allow us to draw a conclusion about the convergence rate and general performance.
The Setup
We use a 1x1 pixel sample in all renderers. Adaptivity is disabled as well as all additional bounces. In Arnold, the light samples are attributes of the geometry. In RenderMan/RIS the light samples are attributes of a custom shape.
Notes About Sampling Parameters
Arnold
3Delight
RenderMan
Results
Arnold
In 3Delight, the light attributes are on Maya's area light.
| Info |
|---|
Admittedly, those are not standard settings for any useful render. The goal here is to isolate one algorithm in order to understand its behaviour. Understanding an algorithm can shed light on its strengths and weaknesses and allows us to draw interesting conclusions for the more general case. |
| Arnold | RenderMan/RIS | 3Delight OSL |
|---|
| General Parameters | 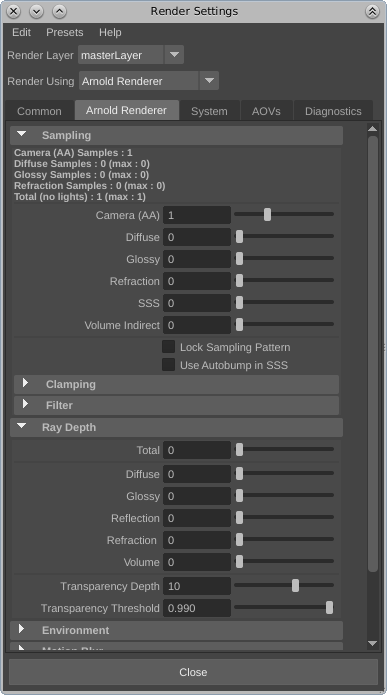 Image Added Image Added
| 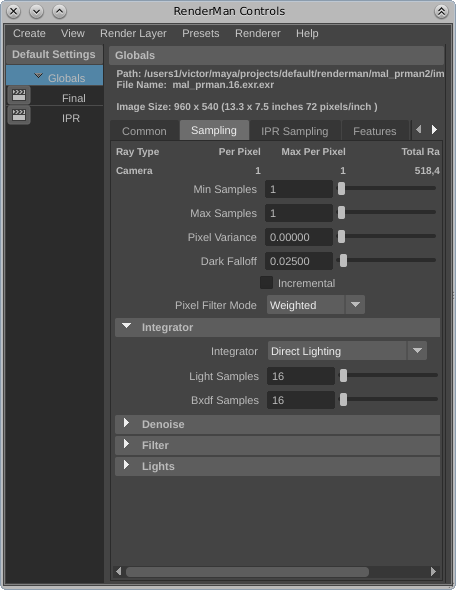 Image Added Image Added
| 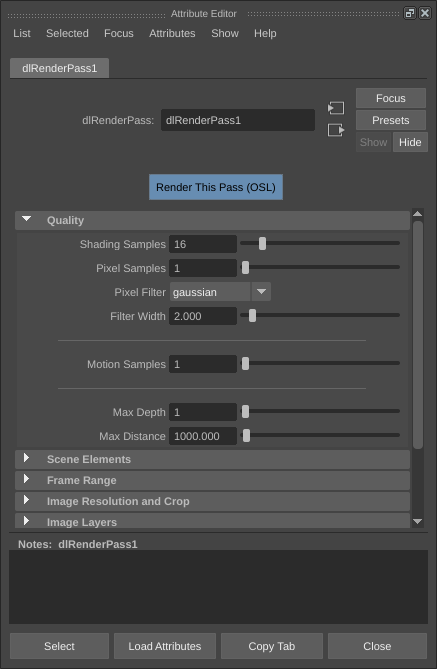 Image Added Image Added
|
|---|
| Geo Light Parameters | 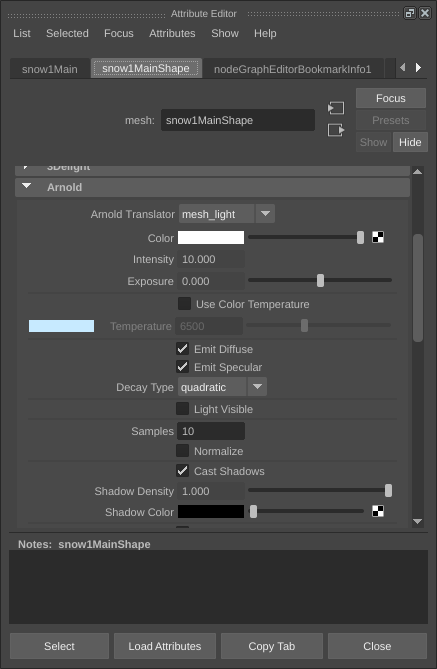 Image Added Image Added
|  Image Added Image Added
| 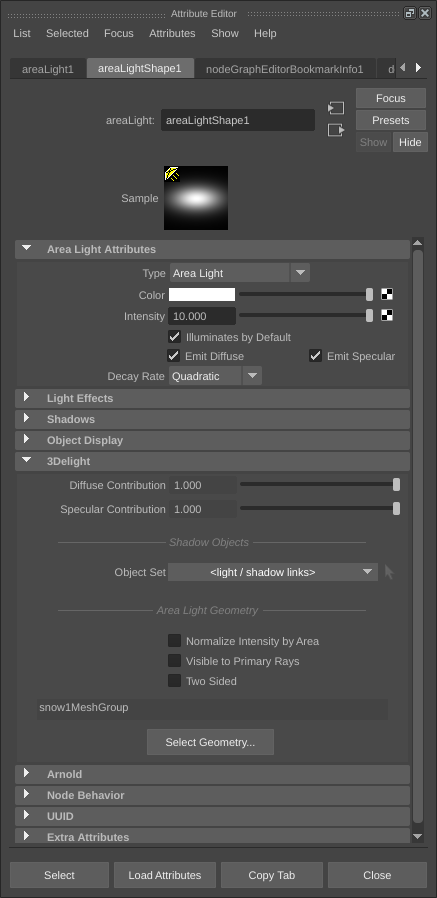 Image Added Image Added
|
|---|
Notes
Arnold — For light samples, Arnold uses effective sample counts that are proportional – within a constant – to the square of the user specified value. As we will see, this makes sense from a UI standpoint since the variance follows the inverse of the same rule in the case of Arnold. This makes the light samples slider linear in term of perceived noise. In the Arnold tables below, we will specify the effective samples per pixel along with the user samples. Those effective samples are gathered from Arnold's diagnostics files.
RenderMan/RIS – While in Arnold the light samples effectively control image quality when only direct lighting is needed, in RenderMan/RIS, we had to match light samples count with BxDF samples count to achieve acceptable quality and satisfactory convergence rates. Using light samples only, or BxDF samples only, produced noisy renders. In the RenderMan/RIS results below, "N samples" means N samples for both light and BxDF. We did all the tests with the "advanced (mode 4)" light sampler since it produced the best results. The samples used by the renderer are the ones entered in the UI and are not squared as in Arnold. Note that we used the path tracer with one bounce instead of the "direct lighting" algorithm for one of the images because of a crash (quality and speed did not seem to suffer although there were some minor differences in the render).
3Delight – We have only one control for the general quality of the render. In the case of direct lighting, 3Delight "understands" that samples are best used for light sampling and that's what it does. As the tests will show, those samples have a linear impact on perceived noise levels.
Results
The following graph gives a good idea on the convergence rate of the different light samplers.
| | Chart |
|---|
| width | 800 |
|---|
| domainAxisUpperBound | 300 |
|---|
| title | RMSE vs. RAYS |
|---|
| type | xyLine |
|---|
| yLabel | RMSE |
|---|
| domainAxisLowerBound | 0 |
|---|
| xLabel | Million Rays |
|---|
|
| Rays | 2.45 | 3.13 | 4.51 | 7.27 | 12.78 | 23.8 | 45.88 | 90.1 |
|---|
| 3Delight | 0.0933142 | 0.0658266 | 0.0441248 | 0.0290439 | 0.0185575 | 0.0117566 | 0.00752546 | 0.00449892 |
|---|
| Rays | 0.678 | 3.26 | 10.8 | 16.94 | 43.4 | 173.6 | 694.5 |
|---|
| Arnold |
|---|
|
|
| Samples | 2 (1.23) | 4 (4.91) | 8 (19.64) | 16 (78.56) | 32 (314.29) | 64 (1257.18) |
|---|
Image | 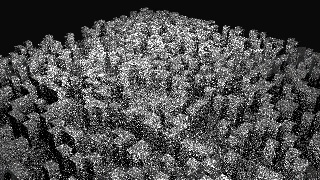 Image Removed
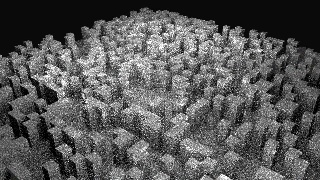 Image Removed Image Removed
| 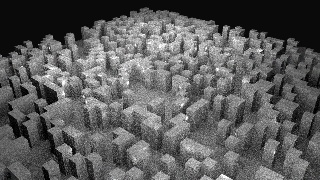 Image Removed Image Removed
| 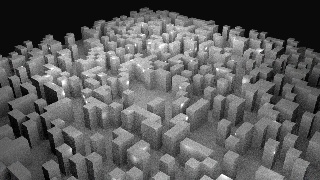 Image Removed Image Removed
| 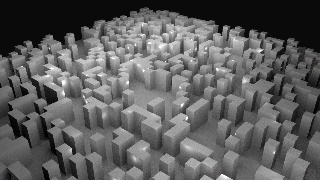 Image Removed Image Removed
| 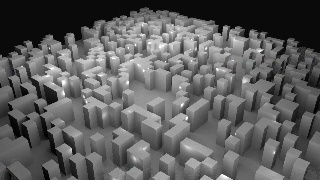 Image Removed Image Removed
| | Time | 1s | 2s | 6s | 21s | 1:21 | 8:12 |
|---|
| Shadow Rays | 0.678 M | 3.26 M | 10.8 M | 43.4 M | 173.6 M | 694.5 M |
|---|
RMSE | 0.15699 | 0.100115 | 0.0501787 | 0.0396399 | 0.0242515 | 0.0117413 | 0.00693426 |
|---|
|
|
...
Samples| 4 | 8 | 16 | 32 | 64 | 128 | 256 | | Image | 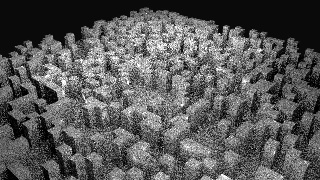 Image Removed Image Removed
| 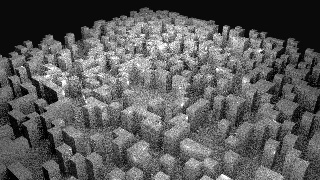 Image Removed Image Removed
| 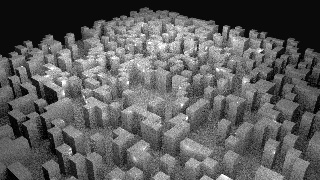 Image Removed Image Removed
| 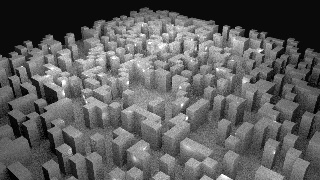 Image Removed Image Removed
| 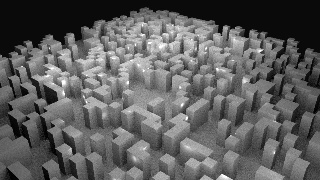 Image Removed Image Removed
| 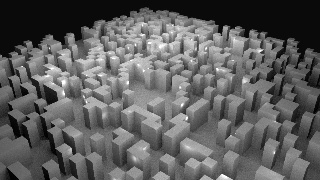 Image Removed Image Removed
| 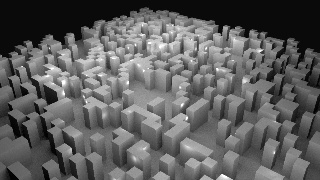 Image Removed Image Removed
| 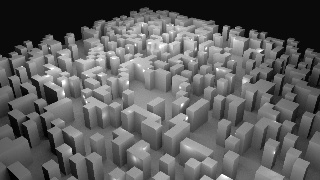 Image Removed Image Removed
|
|---|
| Time | 5.72s | 8s | 12.82 s | 22.18 s | 40.92 s | 86.91 | 165.69 s | 302.98 |
|---|
| Shadow Rays | 2.45 M | 3.13 M | 4.51 M | 7.27 M | 12.78 M | 23.8 M | 45.88 M | 90.1 M |
|---|
| 5.88 | 11.7 | 21.1 | 47.02 | 94.14 | 376.3 | 751.3 | | RenderMan/RIS | 0.151125 | 0.121487 | 0.0953649 | 0.0728148 | 0.0520606 | 0.0373876 | 0.0265388 | 0.0138148 | 0.00854045 |
|---|
|
|
The following graph shows the time required to achieve a certain quality. From user's perspective, this is an important quantity.
| | Chart |
|---|
| width | 800 |
|---|
| title | RMSE vs. TIME |
|---|
| type | xyLine |
|---|
| yLabel | RMSE |
|---|
| xLabel | Time (seconds) |
|---|
| | Time | 5.24 | 7.18 | 11.21 | 20.68 | 35.86 | 69.48 | 134.18 | 265.05 |
|---|
| 3Delight |
|---|
|
|
RMSE | 0.0933142 | 0.0658266 | 0.0441248 | 0.0290439 | 0.0185575 | 0.0117566 | 0.00752546 | 0.00449892 |
|---|
|
|
...
| Samples | 4832642565121024 | | Image | 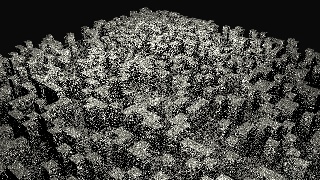 Image Removed Image Removed
| 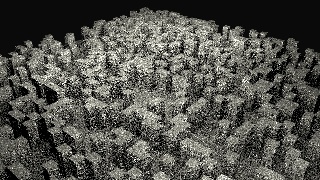 Image Removed Image Removed
| 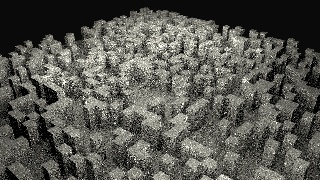 Image Removed Image Removed
| 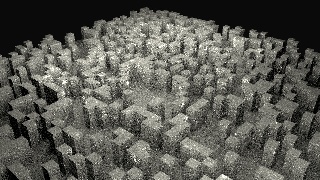 Image Removed Image Removed
| 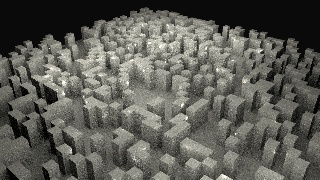 Image Removed Image Removed
| 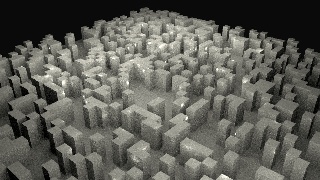 Image Removed Image Removed
| 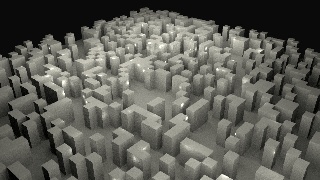 Image Removed Image Removed
| 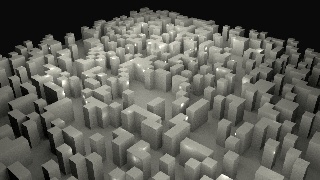 Image Removed Image Removed
| 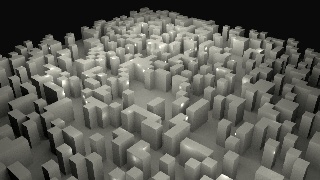 Image Removed Image Removed
|
|---|
| 0.15699 | 0.100115 | 0.0501787 | 0.0396399 | 0.0242515 | 0.0117413 | 0.00693426 |
|
|
74s23s99s42s51s1:38RMSE | 3:15.77 | 6:23.39 | | Rays | 1.47 M | 2.94 M | 5.88 M | 11.7 M | 47.02 M | 94.14 M | 376.3 M | 751.3 M | 1499 M |
|---|
| 0.151125 | 0.121487 | 0.0953649 | 0.0728148 | 0.0373876
| 0.0265388 | 0.0138148 | 0.00854045 |
|
|
0.00396...
graph shows how much time it takes to build the acceleration data structure depending on sample/ray count.
| | Chart |
|---|
| width | 800 |
|---|
| domainAxisUpperBound | 300 |
|---|
| title |
|---|
|
|
RMSE RAYSRMSE| Time to First Pixel (seconds) | | domainAxisLowerBound | 0 |
|---|
| rangeAxisUpperBound | 50 |
|---|
| xLabel | Million Rays |
|---|
| | Rays | 2.45 | 3.13 | 4.51 | 7.27 | 12.78 | 23.8 | 45.88 | 90.1 |
|---|
| 3Delight |
|---|
|
|
0.0933142 | 0.0658266 | 0.0441248 | 0.0290439 | 0.0185575 | 0.0117566 | 0.00752546 | 0.00449892| Rays | 0.678 | 3.26 | 10.8 | 43.4 | 173.6 | 694.5 |
|---|
| Arnold | 0 |
|---|
|
|
.1569910011500501787002425150.0117413 | 0.00693426| Rays | 1.47 | 2.94 | 5.88 | 11.7 | 47.02 | 94.14 | 376.3 | 751.3 |
|---|
| RenderMan | 3 | 3.2 | 4 | 4.7 | 9 | 15.5 | 51.2 | 97 |
|---|
|
|
Arnold
*TTFP = Time to first pixel.
| Samples (effective) | 2 (1.23) | 4 (4.91) | 8 (19.64) | 10 (30) | 16 (78.56) | 32 (314.29) | 64 (1257.18) |
|---|
| Image |  Image Added Image Added
|  Image Added Image Added
|  Image Added Image Added
| 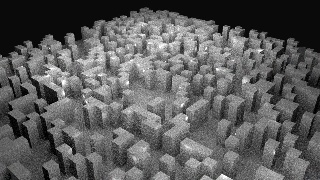 Image Added Image Added
|  Image Added Image Added
|  Image Added Image Added
|  Image Added Image Added
|
|---|
| Time | 1 sec. | 2 sec. | 6 sec. | 9 sec. | 21 sec. | 81 sec. | 492 sec. |
|---|
| TTFP* | 0 sec. | 0 |
|---|
.1511250.121487 | 0.0953649 | 0.0728148 | 0.0373876 | 0.0265388 | 0.0138148 | 0.00854045 | The following plot gives us a good idea the time required to achieve a certain quality. From the user perspective, this is an important quantity.
| .35 sec. | 1.2 sec. | 2.0 sec. | 3.2 sec. | 11 sec. | 41 sec. |
| Shadow Rays | 0.678 M | 3.26 M | 10.8 M | 16.94 M | 43.4 M | 173.6 M | 694.5 M |
|---|
| RMSE | 0.15699 | 0.100115 | 0.0501787 | 0.0396399 | 0.0242515 | 0.0117413 | 0.00693426 |
|---|
3Delight
| Samples | 2 | 4 | 8 | 16 | 32 | 64 | 128 | 256 |
|---|
| Image |  Image Added Image Added
|  Image Added Image Added
|  Image Added Image Added
|  Image Added Image Added
|  Image Added Image Added
|  Image Added Image Added
|  Image Added Image Added
|  Image Added Image Added
|
|---|
| Time | 5.24 sec. | 7.18 sec. | 11.21 sec. | 20.68 sec. | 35.86 sec. | 69.48 sec. | 134.18 sec. | 265.05 sec. |
|---|
| TTFP | 2 sec. | 2 sec. | 2 sec. | 2 sec. | 2 sec. | 2 sec. | 2 sec. | 2 sec. |
|---|
| Shadow Rays | 2.45 M | 3.13 M | 4.51 M | 7.27 M | 12.78 M | 23.8 M | 45.88 M | 90.1 M |
|---|
| RMSE |
|---|
| Chart |
|---|
| width | 600 |
|---|
| title | RMSE vs. TIME |
|---|
| type | xyLine |
|---|
| yLabel | RMSE |
|---|
| xLabel | Time |
|---|
|
| Time | 5.72s | 8 | 12.82 | 22.18 | 40.92 | 86.91 | 165.69 | 302.98 |
|---|
3Delight | 0.0933142 | 0.0658266 | 0.0441248 | 0.0290439 | 0.0185575 | 0.0117566 | 0.00752546 | 0.00449892 |
|---|
RenderMan/RIS
Time| 6 | 21 | 81 | 492 | Arnold | 0.15699 | 0.100115 | 0.0501787 | 0.0242515 | 0.0117413 | 0.00693426 | 4 | 8 | 16 | 32 | 64 | 256 | 512 | 1024 |
|---|
| Image |  Image Added Image Added
|  Image Added Image Added
|  Image Added Image Added
|  Image Added Image Added
| 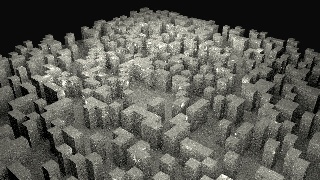 Image Added Image Added
|  Image Added Image Added
|  Image Added Image Added
|  Image Added Image Added
|  Image Added Image Added
|  Image Added Image Added
|
|---|
| Time | 6.74 sec. | 7.23 sec. | 7.99 sec. | 9.42 sec. | 12.12 sec. | 18.51 sec. | 29.40 sec. | 98.08 |
|---|
383.39 | RenderMan| sec. | 195.77 sec. | 6:23.39 min:sec. |
| TTFP | 3.1 sec. | 3.2 sec. | 4 sec. | 4.7 sec. | 6.7 sec. | 9 sec. | 15.5 sec. | 51.2 sec. | 97 sec. |
|
|---|
| Rays | 1.47 M | 2.94 M | 5.88 M | 11.7 M | 21.1M | 47.02 M | 94.14 M | 376.3 M | 751.3 M | 1499 M |
|---|
| RMSE | 0.151125 | 0.121487 | 0.0953649 | 0.0728148 | 0.0520606 | 0.0373876 | 0.0265388 | 0.0138148 | 0.00854045 |
|---|
...
Conclusions
- 3Delight generates light samples that are significantly better than algorithmically better (in term of variance) than both Arnold and Prman. RenderMan. In short, for x effective samples:
- 3Delight Variance ~ 1/x
- Arnold Variance ~ 1/sqrt(x)
- RenderMan/RIS Variance ~ 1/sqrt(x) (possibly slightly worse but could be within a constant)
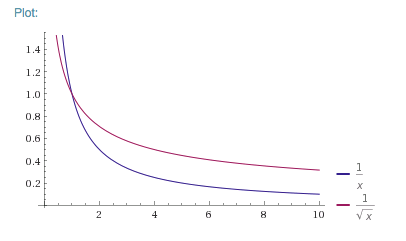 Image Added
- 3Delight is slower to to generate these samples. Meaning that for For draft renders Arnold/PrMan will seem faster(high variance), Arnold is fastest. For final renders (low variance) 3Delight is fastest and becomes increasingly faster .
- Using so much less samples also makes 3Delight faster when shading is more expensive
- RenderMan seems to have difficulties in sampling.
- Arnold has a solid albeit O(N^2) algorithm (vs O(N) in 3Delight) and compensates to a certain degree with very fast light sampler.
When combining BRDFs, 3Delight is even less noisy. - with increasing samples.
- Arnold and RenderMan/RIS draw samples at about the same speed, but the quality of Arnold samples is better.
- Both Arnold and RenderMan/RIS produce biased images at low sample counts. More specifically: images are darker. 3Delight manages to keep the same energy overall independently of sample counts.
- Arnold, 3Delight and RenderMan/RIS rely on acceleration data structures to sample the geometric area lights. In Arnold and RenderMan/RIS, the algorithmic complexity to build those data structures is tied linearly to the number of samples (as well as the complexity of the light). In 3Delight, only the complexity of the light matters (time to first pixel for 3Delight was 2-3 seconds no matter how many samples there were).
Resources


