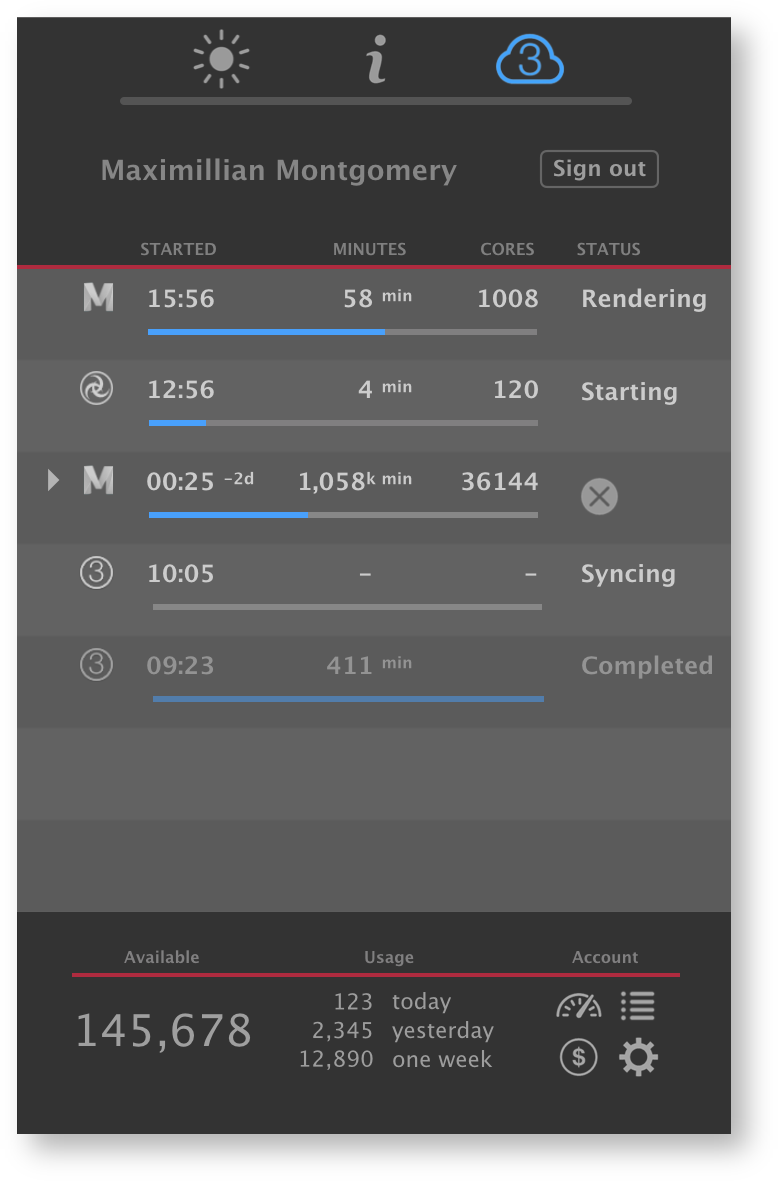
The 3Delight Cloud Dashboard, located under the cloud tab
...
in 3Delight Display's sidebar, is a general monitoring tool
...
of your ongoing cloud
...
renderings. It
...
monitors not only
...
the rendering as it
...
happens in 3Delight Display's image view, but any cloud rendering
...
happening under your account
...
– such as renderings launched using
...
command lines and renderings launched using other applications or on another computer at another location.
Here is a complete description of the content of the dialog.
3Delight Cloud
...
Dashboard in 3Delight Display
Rendering Activity Details
| Indicates the rendering of a sequence of images. Clicking on the arrow will expand it |
|---|
...
| to list all images within the sequence that are at some stages of the rendering process. | |
| Icon |
...
| to identify the application used to lunch the rendering. |
...
| Shown here is the icon for renderdl. There are icons for: Maya, Render (Maya Batch), Houdini, Cinema 4D, Katana, Katana Batch |
...
| and renderdl (3Delight's command line) |
...
| . | |
STARTED | Time at which the rendering process |
|---|
...
| started. |
32-CORE MINUTES |
|---|
...
| This is the meter for the rendering cost — the number of cloud minutes spent so far on the rendering |
...
| . |
...
| It is counted as a quantity of |
...
| 32-core |
...
| minutes usage |
...
| . The more cores are used during the rendering, the faster this meter increases (i.e. it will increase 10 times faster at 1000 cores than at 100 cores during rendering). For the first |
...
| three 32-core minutes, the quantity is displayed in seconds. Note: During the syncing, minutes are not counted, nor charged. |
CORES |
|---|
...
During rendering, it indicates the number of cores used |
...
. This value typically fluctuates during the course of the rendering |
...
. As it fluctuates over time, it affects the rate of increase of the 32-CORE MINUTES meter. Once the rendering is finished (successfully or not), it indicates the average (time weighted) number of cores that were used over the course of the rendering. | |
STATUS | Indicates the status of the process — such as Syncing, Starting, Rendering, Completed, Waiting, Aborted, etc. The list of reported statuses |
|---|
...
are described in detail here. | |
| This icon will be shown while hovering a rendering process on the list. Click to cancel that rendering process. |
|---|
...
* When a rendering process is finished (successfully or not),
...
it remains in the list in a subdued shade for one hour
...
.
Account Information
At the bottom of the
...
dashboard, a summary of the user's account information is presented.
...
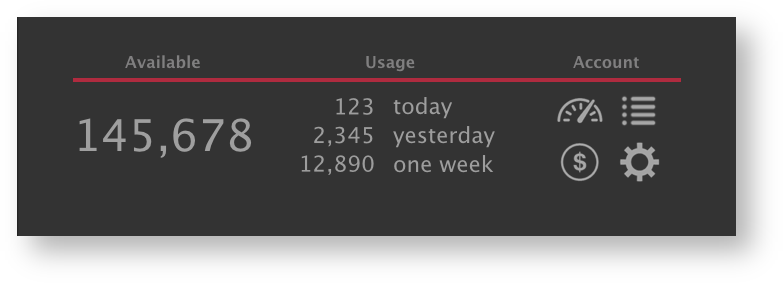
Description:
Available | Shows the minutes credits available in the account. |
|---|---|
Usage | Shows |
...
recent usage in minutes. Today is from midnight until now. Yesterday is the full 24 hours of the previous day. One week is the previous 7 |
...
days (not including today). |
Account |
|---|
...
| The four icons are |
...
| links to the |
...
| user's online account at the following pages: Account Overview, |
...
| Transaction History (payments and renders), Purchase Credits, Account Settings. |