3Delight statistics are divided in many groups. Each statistic group contain similar quantities. For example, the "Ray Tracer" group contains all statistics that affect ray tracer operations. The following table lists all the groups as well as their JSON legalized names and comments.
| Group | JSON name | Description |
|---|---|---|
| Render Option | render_options | Contains global rendering options that have been (usual) set by the user. |
| System | system | Contains options related to the system/hardware on which the image has been rendered. |
| Profiling | profiling | Contains timings for different parts of the renderer. |
| Memory | memory | Contains information and memory profiling for different structures in the renderer. |
| Texture Cache | texture_cache | The texture cache plays an important part in the overall performance of 3Delight. The cache is needed since available physical memory is usually much less than the space taken by all the textures for a certain render. The role of this cache is to keep and manage the texture data needed for rendering. |
| Ray Tracer | ray_tracer | Contains data related to all operations of the ray tracer. |
| REYES | reyes | Contains data related to the workings of the REYES rendering engine. |
Statistics Description
The following table goes through every statistic available in every group.
' * ' = deprecated.
| Keyword | Type | Units | Description |
|---|---|---|---|
System | |||
time_to_first_pixel | real | seconds | Time it take for the first pixel to appear. |
| network_traffic | table | ||
| disk_traffic | table | ||
load_average | [real, real, real] | Load average is a gauge of how many processes are on average, concurrently demanding CPU attention. The three numbers are averages for 1, 5 and 15 minutes. Very detailed description of load averages can be obtained on Linux manpages of uptime. A good technical overview can be found here and good vulgarization can be found here. | |
Profiling | |||
timings | table | time | Time taken to produce the image, for a wide range of timed categories. Different categories are explained in Profiling Categories. |
memory_profile | table | M | Memory used to produce the image, for a wide range of categories. |
peak_virtual_memory | real | M | The peak virtual memory while rendering. Note that 3Delight could consume large amounts of virtual memory on 64 bits machines. This doesn't mean that it will actually uses all the virtual space it allocated (far from it). |
peak_resident | real | M | Peak resident memory as computed by 3Delight. |
peak_from_malloc | real | M | Peak as returned from system allocator. |
system_time | [real, real, real] | ||
cpu_usage | [real, real, real] | CPU usage in %. | |
Netword Cache | |||
cache_size | real | GB | As specified by the user. |
used_size | real | GB | Amount of space already used. |
number_of_copied_files | integer | Total number of files copied to that cache during this rendering session | |
number_of_failed_copies | integer | Copies that failed for system reasons (space, permissions, etc ...) | |
number_of_copies_avoided | integer | Copies avoided because files already in cache | |
number_of_rejected_files | integer | Files not copied because cache is full | |
*number_of_copies_avoided_kb | integer | Kb | Same as number_of_copies_avoided but in Kb. |
data_not_cached | integer | Kb | Data not cached due to lack of space. |
data_copied | integer | Kb | Total amount of data that has been copied to the cache during the rendering sessions. |
Textures | |||
number_of_maps | integer | Total number of maps (textures, shadow maps, deep shadow maps, etc ...) managed. | |
number_of_texture_maps | integer | ||
number_of_shadow_maps | integer | ||
number_of_deep_shadow_maps | integer | ||
number_of_invalid_maps | integer | ||
number_of_file_open_operations | integer | Total number of file open operations performed during a rendering session. Should be relatively low thanks to caching. Could be high on systems configured with not enough file descriptors. | |
*number_of_map_requests | integer | Total number of maps requested | |
texture_access_statistics | table | ||
texture_ids | group | List of texture ids needed to understand texture_access_statistics | |
Texture Cache | |||
cache_size | real | GB | Size of RAM texture cache. |
footprint_of_textures | real | The texture footprint is the total amount of data seen by the cache during a render. It's the size the cache should be made to hold everything needed in memory. This is a good metric of how much data a scene is using. Note that the cache does not have to be that large to be fully efficient in most cases. | |
footprint_of_misc | G | Same as footprint_for_textures but applies to other textures such as 3D textures (brick maps). | |
pressure | real | The cache pressure is the ratio between the footprint and the amount of data actually loaded into the cache, counting data which is loaded more than once because it was flushed. For example, at 2 each texture tile is loaded on average twice, which is actually not that bad. At 10, we're loading each tile 10 times, which is not that good anymore. A pressure of 1 indicates a fully efficient cache. This number is directly proportional to the texture loading time described in the Profiling section above. If the pressure goes from 4 to 2 then loading time will be halved. | |
pressure_from_textures | real | Pressure from 2D textures. | |
pressure_from_misc | real | Pressure from other kind of textures (such as 3D textures). | |
Scene | |||
number_of_objects | integer | Total number of high level objects passed to renderer. | |
number_of_attributes | integer | Number of RenderMan attributes needed to describe the scene. | |
number_of_transforms | integer | Number of transforms in the scene. | |
primitive_compression_ratio | real | While rendering, 3Delight uses a compression algorithm for geometric primitives residing in memory. This statistic indicates the compression ratio. | |
saved_memory | real | Mb | Memory saved thanks to compression. |
REYES | |||
number_of_mps | integer | Total number of micro polygons generated to produce the image. | |
average_mps_per_grid | integer | Average number of micro polygons per grid. | |
grids_projected | integer | Total number of grids projected to screen. | |
grids_shaded | integer | Total number of grids that have been shaded. Some projected grids might not need shading after projection because they are rejected by visibility culling. | |
grids_displaced | integer | Total number of displaced grids. | |
number_of_primitives | integer | Total number of low-level primitives. | |
number_of_rejected_primitives | Total number of low-level primitives that have been efficiently rejected because they were are not seen in the image. | ||
number_of_non_empty_buckets | integer | ||
average_items_per_bucket | integer | Average number of items (primitive, grid, particle, etc ...) in a bucket. | |
maximum_items_in_a_bucket | integer | Maximum items found in a single bucket. | |
distribution_of_micropolygon_area | histogram | An histogram representing the distribution of the area of micro-polygons. Distributions skewed towards lower values mean slower renders. | |
distribution_of_fragment_lists | histogram | Depth complexity. | |
number_of_trimming_operations | integer | Number of trim curves operations. Non zero when scene contains NURBS and trim curves. | |
maximum_mp_area | real | Maximum micro polygon area in the scene. | |
mininum_mp_area | real | Minimum micro polygon area in the scene. | |
average_mp_area | real | Average micro polygon area in the scene. | |
*curves_grouping_efficiency | real | Internal. | |
Ray Tracer | |||
number_of_rays | integer | Total number of traced rays. | |
number_of_shader_calls | integer | Total number of shader calls. | |
travelled_distance | real | camera space units | Total travelled distance for all traced rays. |
number_of_arealight_probes | integer | Total number of ray probes for area light sampling. | |
average_objects_in_ray_path | real | Average number of objects any each ray crosses during scene traversal. Higher values lead to slower render. Values close to a hundred can be seen when rendering fur or hair. | |
number_of_patch_intersection_tests | integer | Total count of intersection tests with the lowest level geometrical primitives in 3Delight. | |
space_partition_efficiency | real | Proportion of rays hitting an object after they enter a space partition leaf. | |
bounding_volume_efficiency | real | Proportion of rays hitting an objects they they enter objet's bounding volume. | |
average_ray_packet_size | real | ||
approximations | real | Percentage of intersection tests that used geometric approximations. | |
cache_pressure | real | Pressure on displaced geometry cache. | |
distribution_of_ray_depth | histogram | ||
distribution_of_shading_groups | histogram | Represents the distribution of shading group sizes. Histograms skewed to lower values represent less efficient shading. | |
distribution_of_ray_types | table | A table describing how many rays were traced, per type (specular, diffuse, transmission, ...). Note that this is a table, not an histogram. | |
distribution_of_shader_calls | table | Describes how many shader calls were performed, per ray type. | |
| (real, integer) | ( bounding box intersection per ray, total bbox intersection ) | |
Point Based Subsurface Scattering | |||
distribution_of_lookup_depth | histogram | An histogram representing the lookup depth in the hierarchical structure used to store the point-based scene representation. Histograms skewed to lower values mean faster renders. A technical statistic that is not really telling for an artist. | |
Space Partitioner | |||
number_of_nodes | integer | Total number of nodes (internal and leafs) in the space partitioner. | |
motion_density | real | ||
motion_segments | integer | ||
tree_depth | integer | Maximum leaf node depth in the space partitioner. | |
number_of_rays | integer | Total number of rays that went through the space partitioner. | |
average_leafs_per_ray | real | Average number of leaves a ray encounters during tress traversal. | |
average_internal_nodes_per_ray | real | Average number internal nodes a ray encounters during tree traversal. | |
*average_depth_per_leaf | real | ||
average_objects_per_leaf | real | ||
average_packet_size_at_root | real | Ray packet size when packet is entering the root of the tree | |
average_packet_size_at_leaf | real | Ray packet size when packet is entering a leaf of the tree | |
number_of_bbox_intersections | integer | ||
number_of_bbox_intersections_per_ray | real | It is useful to compare this number with the average_objects_in_ray_path | |
Point-Based Global Illumination | |||
number_of_queries | integer | Total number of lookups in the point-based representation of the scene. | |
number_of_elements_per_query | real | Average number of elements considered for each query. Higher numbers usually indicate slower queries/renders. | |
Point-Based Subsurface Scattering | |||
number_of_nodes | integer | Total number of nodes (internal and leaf) in data structure (tree) used for point-based subsurface scattering. | |
tree_depth | integer | ||
number_of_queries | integer | ||
number_of_leaf_computations | integer | Number of subsurface computation performed using the leafs of the tree. | |
number_of_hierarchical_computations | integer | Number of subsurface computation performed using higher (aggregate) tree levels. Using such aggregate computations accelerate overall render time. | |
minimum_visited_leafs_per_query | integer | ||
maximum_visited_leafs_per_query | integer | ||
average_visited_leafs_per_query | integer | ||
Photon Maps | |||
number_of_photons | integer | Total number of traced photons. | |
number_of_interactions | integer | Total number of photon/surface interactions. | |
number_of_global_photons | integer | Number of photons stored in global photon maps. | |
number_of_caustic_photons | integer | Numbe of photons stored in caustic photon maps. | |
average_bounces | real | Average number of bounces a photon does before terminating or exiting scene. | |
average_diffuse_depth | real | Average depth of photons stored in the global photon map. | |
average_caustics_depth | real | Average depth if photons stored in the specular photon map. | |
Profiling Categories
This statistic block gives several timings about the render. Each task shows the wall clock time it took in the total render time. Follows a description for all possible tasks.
| Task | Description |
|---|---|
raytracer init | This task includes all the work that needs to be done before starting the space parition. Basically this means iterating through all scene objects and prepare structures for the upcoming render. |
ray tracer instance init | This task counts the time that is spent on optimizing instances (when "shared instances" are enabled). |
space partition init | This task counts the time it takes 3Delight to build the space partitioner (a BVH-like structure). The time spent here will go proportionally with the scene size. |
surface shaders | Counts the amount of time the renderer is spending inside surface shaders. Complex shaders (as generated, for example, by comlexe shading networks in Maya or Softimage) will lead to higher times in this task. |
light shaders | Counts the time spent in light shaders. |
volume shaders | Counts the time spent in volume shaders. |
displacement shaders | Counts the time spent in displacement shaders. |
imager shaders | Counts the time spent in imager shaders. |
RSL plugins | Counts the time spent in custom RSL plug-ins. |
shadowmap filtering | Counts the time spent filtering shadow maps to render shadows. |
dsm filtering | Same as for shadow map filtering but for deep shadow maps. |
texture filtering | Counts the time spent filtering texture maps. If this times seems too high compared to total render time (>10%) it could be one of the following reasons:
|
point cloud filtering | Counts the time spent filtering point clouds for point-based color bleeding. |
brick map filtering | Counts the time spent filtering brick maps. |
texture loading | Counts the time spent loading texture tiles. Since 3Delight has a caching system for texture loading this time should be marginal compared to the total render time. If not, this probably means that the texture cache is not large enough (read the Texture Cache section). |
shadow map loading | Counts the time spent loading shadow map tiles. |
Example JSON Output and Parsing
Follows and example JSON file output by 3Delight.
To be continued ...
Embedding Statistics Into HTML Documents
It is easy to use the JSON output format to generate nice rendering of statistics. The following example code uses HTML, Chart.js and JavaScript to generate a pie chart representing the percentage for each ray type.
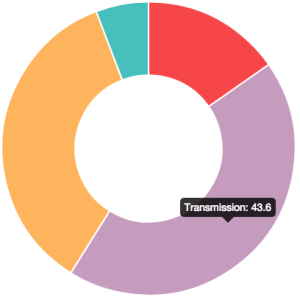
Example pie chart generate using JSON statistics, HTML and Javascript.